

FMECA method and fault tree
The FMECA fault tree represents a powerful methodological combination for anticipating failures, improving safety and enhancing the reliability of industrial installations. Discover how these two complementary approaches can be integrated into your maintenance system to identify each potential failure mode, assess its criticality level and rapidly implement the necessary preventive actions.
In brief
- FMECA and the fault tree are key methodologies for anticipating breakdowns, enhancing safety and optimizing the reliability of industrial plants.
- FMECA identifies failure modes, assesses their severity, frequency and detectability, and is part of a PDCA approach in line with ISO 9001 standards.
- Calculating the RPN (Risk Priority Number) helps prioritize risks and guide preventive actions, while facilitating traceability and continuous improvement.
- Integrating FMECA and fault trees into a CMMS optimizes risk management and boosts the overall performance of industrial systems.
Optimize your maintenance management with a CMMS tailored to your business sector!
Fundamentals of the FMECA method
FMECA (Failure Mode, Effect, and Criticality Analysis) is an analysis method that examines each component or function to identify failures. It then evaluates their severity, occurence of occurrence and likelihood of detection. This ISO 9001-compliant analysis method is part of the PDCA (Plan-Do-Check-Act) continuous improvement cycle, and provides a solid foundation for any preventive maintenance strategy.
Structure and implementation steps
The success of FMECA analysis in maintenance relies on five essential steps, implemented by a multi-disciplinary team of technical experts, quality managers, and operational staff. This collaboration ensures complete system analysis and leads to the development of a detailed fault tree for each piece of equipment.
Optimize the integration of FMECA and fault trees in your CMMS:
- Build a multi-disciplinary team: bring together profiles to identify potential failures and assess criticality.
- Analyze the system in depth: Break down its functions, map interactions and prepare the supports required for risk assessment.
- Identify all failure modes: methodically list possible causes of failure (wear, overload, human error, etc.) and evaluate their impact on the system.
- Quantify risks: Use assessment criteria (severity, occurence, detectability) to objectively prioritize corrective actions.
This approach enables the creation of an accurate risk map, comprehensive documentation of all failure modes, and valuable traceability for future audits, while supporting the continuous improvement process.
RPN calculation and criticality thresholds
This failure analysis method is based on the RPN (Risk Priority Number), calculated by multiplying the ratings for Severity, Occurrence and Detectability, to prioritize risks according to their significance. For example, a leak on a hydraulic cylinder rated G8, 03 and D2 gives an RPN of 48, indicating a significant level of criticality requiring rapid action.
Each industrial sector defines its own intervention thresholds: an RPN greater than 100 requires immediate corrective action, while a score between 40 and 100 triggers scheduled preventive measures High-risk industries such as aerospace and nuclear power generally apply stricter criteria to to ensure the highest levels of safety and reliability.
Digital integration within the CMMS
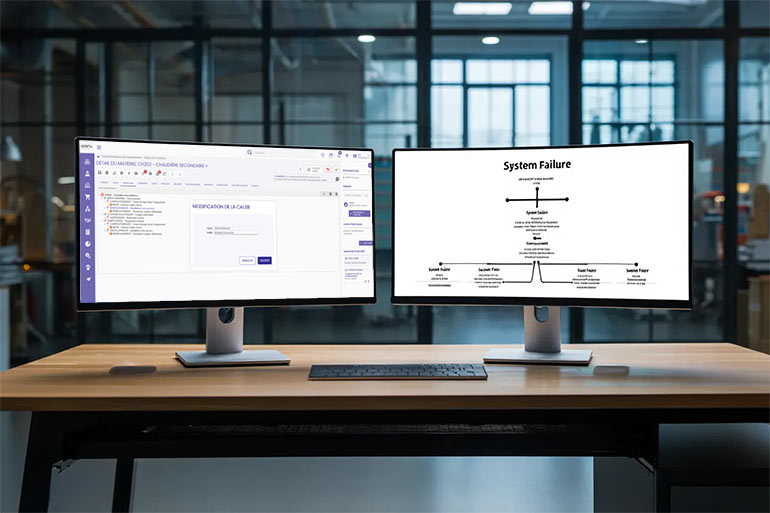
In a modern CMMS, the FMECA module fully integrates this method into the maintenance system: assisted input of parameters, automated calculation of RPN and generation of preventive or corrective work orders. Each update enriches the knowledge base, improves early detection of problems, and enhances overall plant reliability.
The history of interventions enables continuous adjustment of severity, occurence, and detectability parameters, updating each fault tree. Real-Time dashboards display key indicators such as average RPN, residual criticality and failure mode occurence, providing a clear and accurate view of the effectiveness of the measures implemented.
Fault tree: risk analysis and quantification
The Fault Tree Analysis (FTA) method adopts a top-down approach, starting from a target undesirable event and exploring its root causes. This technique provides a visual representation of the various combinations of elementary failures that could lead to a critical incident, thus revealing a system‘s potential weaknesses.
Logical Structure and Logic Gates
The first step is to define the “top event”, i.e. the feared event (such as a production shutdown or an accident). The analysis then breaks down this scenario into intermediate causes, then into observable basic failures. Logic gates (AND, OR) structure these relationships:
- An AND gate requires all input events to occur simultaneously.
- An OR gate is triggered when any one of its input events occurs.
Consider the example of a failure on a production line: three main causes can be linked by an OR gate (faulty motor, sensor failure or operational error). The “motor” branch could itself be broken down into sub-causes linked by an AND gate (mechanical wear AND overheating), creating a complete tree of failure scenarios.
The XOR (exclusive OR) gate is used to model mutually exclusive situations. This operator is particularly useful in complex industrial systems, where interactions between components generate risk dynamics that are difficult to anticipate.
Probabilistic quantification and critical paths
Top-down risk analysis is based on quantitative data:
- Probabilities of elementary failures (derived from maintenance history).
- Specific calculations according to logic gates.
- AND gate: product of probabilities.
- OR door: 1 – product of (1 – probabilities).
This approach identifies the most critical paths in the fault tree.
Implementation in maintenance software
Modern software solutions such as CARL Source Factory automate the creation of fault trees:
- Generation from maintenance intervention histories.
- Intuitive visual interface with a library of standard components
- Customization and validation of causes and associated remedies, ranked by probability.
The results directly support preventive maintenance plans to improve overall reliability.
FMECA and fault tree: differences and complementarity
These two approaches torisk analysis have opposing rationales, but complement each other perfectly when it comes to improving industrial reliability. A good grasp of their particularities enables you to select the right method for each situation, and to achieve complete coverage of failure modes, whether isolated or combined.
Bottom-up versus top-down approaches
The main difference between FMECA and Fault Tree Analysis lies in the direction of the analysis. FMECA follows a bottom-up approach: it starts from individual components and works upward to assess their effects on the overall system. For each failure mode, a Risk Priority Number (RPN) is calculated to prioritize risks.
Knowing how to generate your fault trees from a FMECA facilitates the synergy between these two approaches at the heart of your maintenance system.
Knowing how to generate your fault trees from a FMEA facilitates the synergy between these two approaches at the heart of your maintenance system.
- FMECA: a detailed analysis
It screens each component, assesses the severity, frequency and detectability of failures, and classifies actions according to their level of criticality. - FTA: A System-Level Overview
It maps failure sequences, highlights cascading effects and quantifies the probability of systemic events. - A natural complementarity:
FMEA feeds the fault tree with acurate data, while the fault tree reveals critical scenarios invisible in an isolated analysis.
This duality reflects two risk management philosophies.FMECA is based on systematic prevention through targeted actions. FTA protects against catastrophic scenarios where several simultaneous failures threaten the safety of the installation.
FMEA and fault tree comparison table
| Criteria | FMECA | Fault tree |
|---|---|---|
| Analysis direction | Bottom-up | Top-down |
| Main focus | Individual failure modes | Combinations and interactions |
| Key indicator | RPN (Severity × Occurrence × Detection) | Probability of top event |
| Ideal phase | Design, commissioning | Post-incident analysis, complex systems |
| Main output | Targeted preventive action plan | Critical paths and minimum cuts |
Selection Criteria Depending on the Context
The choice between these two methods depends on the complexity of the installation, the data available and the regulatory framework. Their complementarity often offers the optimum solution for a comprehensive risk analysis.
- System complexity: FMECA is sufficient for simple equipment; a complex system requires FTA to model combinations of failures.
- Available data: FMECA works using qualitative estimates; FTA requires accurate probabilities to quantify scenarios.
- Regulatory requirements: the aerospace and nuclear sectors often impose FTA, whereas ISO 9001 favors FMECA.
- Team skills: FMECA requires business experts; FTA requires skills in Boolean logic and system reliability.
During the design phase, FMECA identifies all potential failure modes and draws up a maintenance plan. This approach improves safety and reliability before commissioning.
Following an incident, FTA reconstructs the chain of causation, revealing systemic weaknesses that a standalone FMECA might not detect. This analysis helps reduce the occurence of serious accidents.
“We needed a market solution with a robust standard, supported by a reliable and scalable publisher. CARL Software’s reputation and the quality of its support convinced us…”
Practical applications and FMECA-FTA best practices
The combined use of these two approaches brings tangible benefits in terms of availability and safety, while reducing maintenance costs. This methodological synergy is a formidable tool for improving reliability and controlling risk in critical systems.
The examples below illustrate how different industries useFMECA and FTA to optimize criticality, estimate probability of failure and define their predictive maintenance strategy, taking into account their specific needs.
Concrete examples by business sector
FMECA-FTA use cases demonstrate the universal applicability of this method to all industrial sectors. In the manufacturing sector, an FMECA analysis of a centrifugal pump reveals “bearing wear” as the main failure mode: with G=8, O=3 and D=1, the RPN reaches 24. This leads us to schedule preventive replacement every five months or 3,000 hours of use, with advance stock management to avoid any shortages.
- Data-center – Critical air-conditioning system: The critical event “loss of cooling” is modeled via a fault tree. Compressor failure (probability 0.02), a fluid leak (0.015) or a faulty thermostat (0.01) result in a cumulative probability of 4.5%. The action plan includes reinforced quarterly inspections and redundancy of the main circuit.
- Water treatment – Municipal plant: The FMEA identifies leaks at the dosing pump seal(criticality 18). The FTA combines this potential failure with contamination of the basin via an ET door, revealing a critical scenario requiring preventive replacement of the seal and weekly bacteriological monitoring.
- Healthcare – Hospital elevator: After identifying failure modes using FMEA, the FTA includes a power failure to assess the probability of a complete shutdown. These analyses justify the installation of a generator and battery backup system, essential for patient safety.
In the food industry, the top event, “production line shutdown,” may result either from a variable occurence drive (VFD) failure or from the combination of two factors (sensor failure AND cooling system malfunction). This analysis demonstrates that simply replacing the sensor is ineffective unless the cooling system is also stabilized. The company therefore adapts its predictive maintenance strategy by implementing monthly thermographic inspections and quarterly cleaning procedures.
Decision factors and implementation
The success of a FMECA-FTA project depends as much on the organization as on the techniques employed. A multidisciplinary team (engineering, maintenance, and quality) pools its knowledge and feedback to address all failure modes and ensure compliance with standards.
Criticality thresholds (RPN) and acceptable probability levels are adapted to the level of risk and financial impact: For example, a critical piece of equipment may require the annual probability of failure to be limited to 0.001%, whereas a production machine may tolerate a probability of up to 5%. The PDCA (Plan-Do-Check-Act) approach supports continuous improvement by planning actions, implementing preventive measures, monitoring reliability indicators, and then updating the FMECA-FTA methodology to ensure its ongoing effectiveness and relevance.

Discover also

Olymel & CARL Source: A Maintenance Transformation Driving Performance
As Canada's leading pork and poultry processor, Olymel exports its products to more than 50 countries and employs over 12,000 people across 22 locations. Facing increasing international competition, regulatory requirements, and cost pressures, the group has made maintenance a strategic priority to ensure operational reliability, and support sustainable growth. To address these challenges, Olymel selected [...]
Grand Chambéry: CARL Source CMMS at the heart of a sustainable performance strategy
At the heart of Grand Chambéry's territory, the water and wastewater department is responsible for preserving an essential resource: water. Responsible for the management and maintenance of facilities and networks in 38 communes, the department faces major challenges: guaranteeing efficient distribution, optimizing yield and preserving the environment through ever more efficient wastewater systems. To support [...]
CARL Software deploys Artificial Intelligence for Maintenance 5.0
At the Global Industrie trade show, CARL Software, a subsidiary of the Berger-Levrault group, will be presenting its solutions enhanced by artificial intelligence and connected by the IoT. CARL Software, specializing in CMMS (Computerized Maintenance Management Systems) and EAM (Enterprise Asset Management), is number one in France and among the European leaders. With 40 years [...]
